
How a UK Garden Machinery Seller Compares Profit Margins Across eBay and Three Online Stores in One Sheet
CML Brands sells lawn mowers across eBay and three WooCommerce stores. We built a profit summary sheet that automatically calculates margins and keeps prices, costs, and profits up to date.
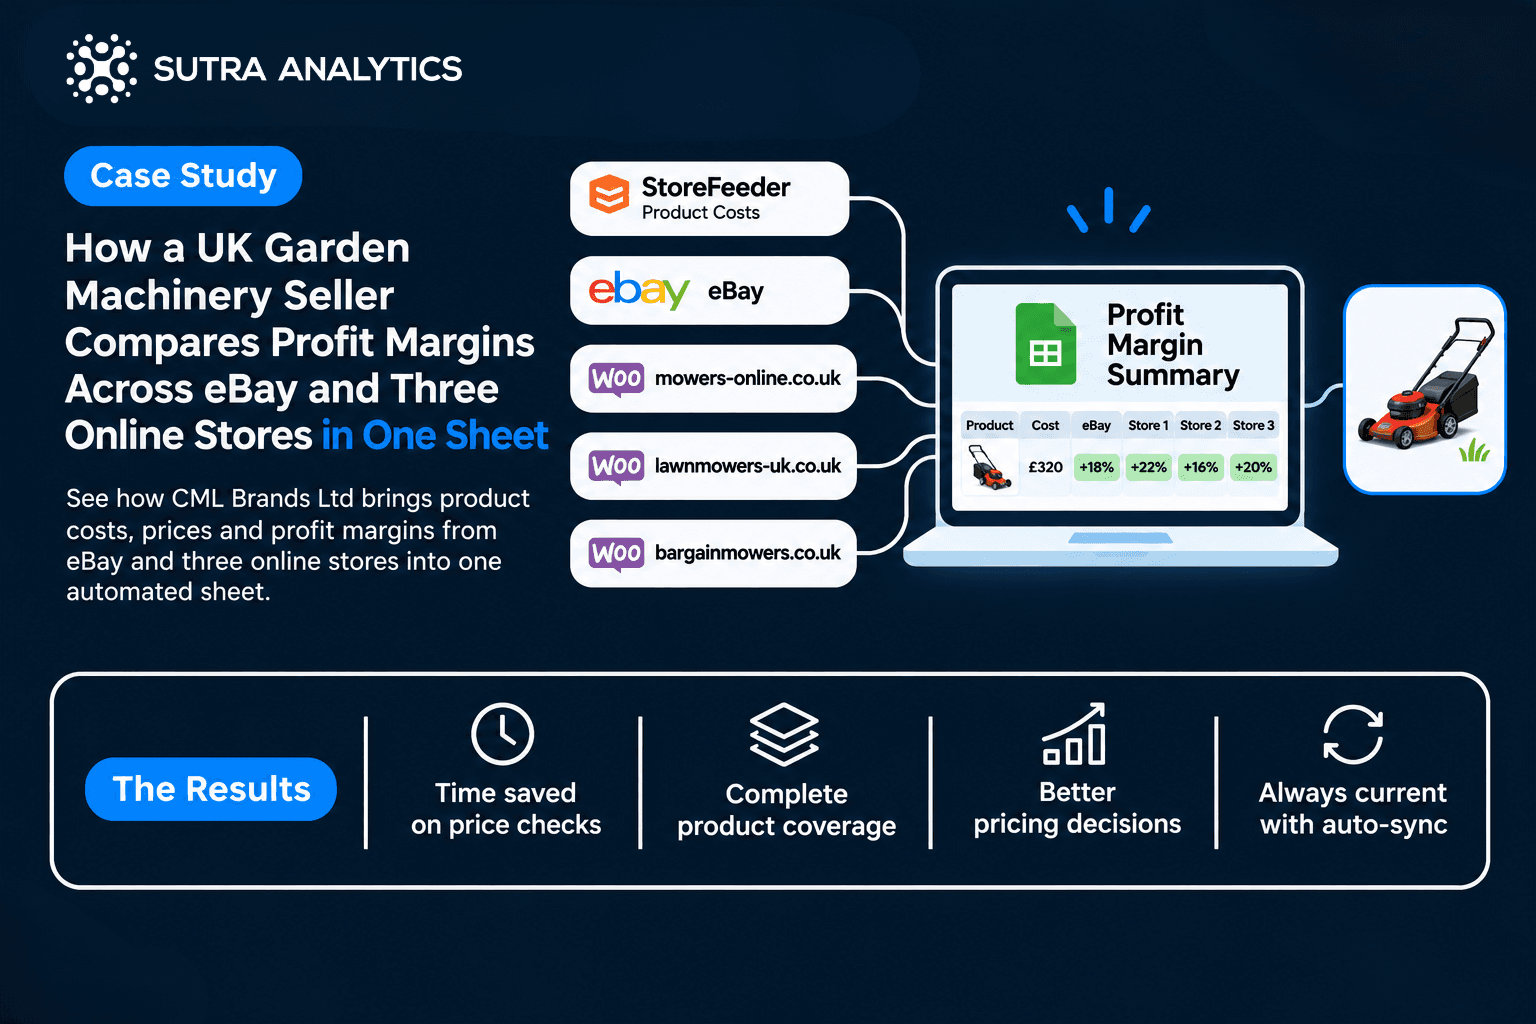
CML Brands Ltd sells lawn mowers and garden machinery across eBay and three WooCommerce stores. With hundreds of products on several platforms, nobody could check whether each one was priced well everywhere. Sutra Analytics built a profit summary sheet that does it automatically and stays up to date.
The Client
CML Brands Ltd is a UK business led by CEO Steve Williams. It sells lawn mowers, ride-on mowers and tractors, lawn care equipment, garden machinery, and spare parts and accessories, from brands such as Honda, Husqvarna, Stihl, Ego, Hayter and Toro. Products are sold through eBay, mowers-online.co.uk, lawnmowers-uk.co.uk, and bargainmowers.co.uk.
The Problem
Product costs live in StoreFeeder, while prices live separately on eBay and on each store. Some products are sold individually and others as kits, so the true cost of a listing is not always obvious. To know whether a product was profitable on a given platform, someone would have to look up its cost, then check its price on every platform and work out the difference. With hundreds of products, that was practically impossible in the time available.
What we built:
We created five connected spreadsheets: one that pulls all eBay products with their prices and listing details, three (one for each WooCommerce store) that pull the products and their details, and a main profit margin spreadsheet that brings it all together.
The main sheet pulls the product cost list from StoreFeeder and lists every product. Using StoreFeeder data, it identifies which products are single items and which are kits, then calculates the total cost of each product or listing.
For each product, the sheet shows:
- Total cost.
- The eBay price, with profit amount and profit percentage.
- The price on each store, with profit amount and profit percentage.
- All data syncs continuously and the calculations update automatically.
What the client can do now:
Instead of opening each store to compare products one by one, Steve works from a single sheet. In a few clicks he can:
Key Capabilities
- See how each product performs on each platform.
- Spot outliers, such as unusually low margins.
- Adjust prices where needed.
- Double down on products that do well on a particular platform.
- Sort the data any way he likes.
- Find his highest and lowest margin products.
Benefits
Time saved: no manual checking across stores. (Estimated saving: [X hours per week, to be confirmed with the client]) | Complete coverage: every product is checked, not just a handful. | Better pricing decisions: differences in cost and percentage between platforms are visible straight away. | Always current: continuous sync keeps prices, costs and margins up to date.
Key takeaways
- Bringing cost and price data into one sheet turns an impossible comparison into a few clicks.
- Distinguishing single products from kits keeps cost calculations accurate.
- Margin visibility across every channel helps decide where to adjust prices and where to push harder.
Is your business running on disconnected tools?
Sutra Analytics helps companies automate and connect their operations.