
5 WooCommerce Metrics Every Store Owner Should Track Weekly
Store owners are drowning in data. Here are the five metrics that actually matter — and how to track them without the overwhelm.
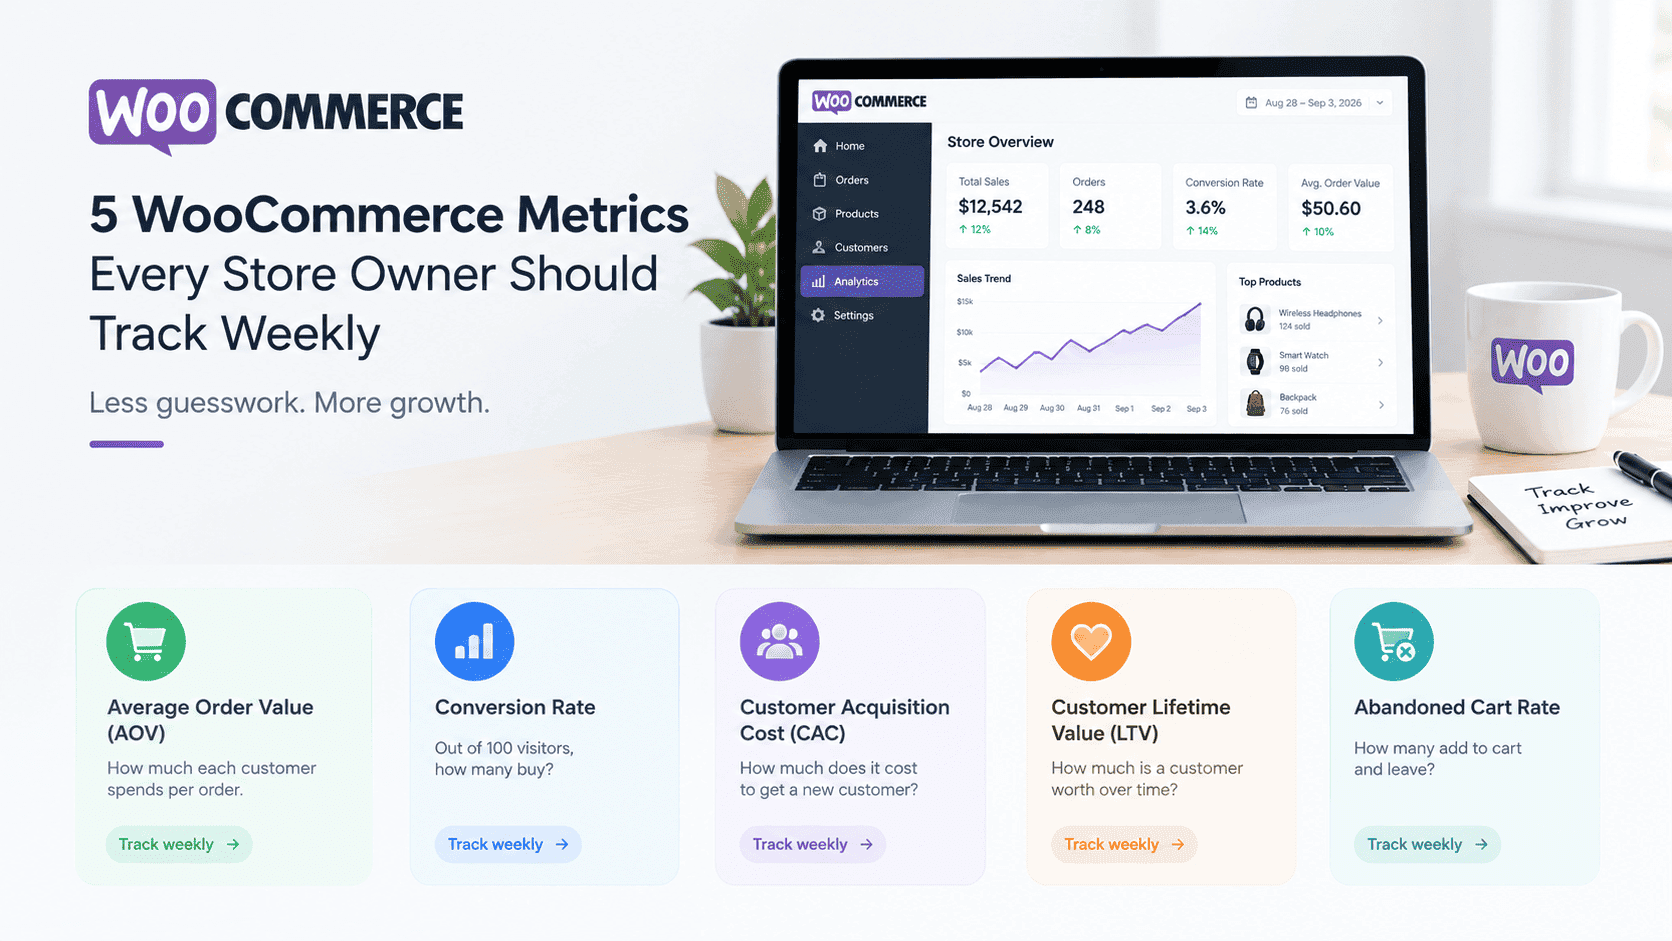
There's no shortage of data in WooCommerce. You can track everything — and most store owners try to. The result is analysis paralysis: too much information, not enough insight.
The key is focus. Here are the five metrics that truly matter:
The 5 Essential WooCommerce Metrics
- Average Order Value (AOV): How much each customer spends
- Conversion Rate: How many visitors become buyers
- Customer Acquisition Cost (CAC): Cost to get a new customer
- Customer Lifetime Value (LTV): Total worth of a customer
- Abandoned Cart Rate: How many people leave without buying
At Sutra Analytics, we help e-commerce businesses build custom dashboards that automatically track these metrics. No more manual calculations — just real-time data at your fingertips.
How to Calculate Each Metric Correctly
Here are the formulas and benchmarks you need:
Average Order Value (AOV)
- Formula: Total Revenue / Number of Orders
- Example: $50,000 revenue / 1,000 orders = $50 AOV
- Benchmark: WooCommerce stores average $80-100 AOV
- To improve: Upsell, cross-sell, offer free shipping thresholds
Conversion Rate
- Formula: (Orders / Sessions) × 100
- Example: 1,000 orders / 50,000 sessions = 2% conversion
- Benchmark: WooCommerce stores average 1.5-3%
- To improve: Optimize product pages, reduce checkout friction
Customer Acquisition Cost (CAC)
- Formula: Total Marketing Spend / New Customers
- Example: $10,000 spend / 200 new customers = $50 CAC
- Benchmark: Should be ≤ 1/3 of LTV
- To improve: Focus on high ROAS channels, improve conversion
Customer Lifetime Value (LTV)
- Formula: AOV × Purchase Frequency × Customer Lifespan
- Example: $50 × 4/year × 2 years = $400 LTV
- Benchmark: WooCommerce LTV typically 3-5× CAC
- To improve: Retention programs, loyalty programs, email marketing
Abandoned Cart Rate
- Formula: (Abandoned Carts / Started Carts) × 100
- Example: 500 abandoned / 1,000 started = 50% abandonment
- Benchmark: WooCommerce average is 60-70%
- To improve: Simplified checkout, guest checkout, exit-intent popups
📊 Where to Track These: WooCommerce Analytics Dashboard, Google Analytics 4, Google Looker Studio, or a Custom Dashboard from Sutra Analytics.
We build custom analytics dashboards for WooCommerce store owners that automatically pull these metrics from your store data. You get a live dashboard that updates in real-time, so you always know exactly how your store is performing.
How Often to Review These Metrics
- Weekly: Track all five metrics and look for trends
- Monthly: Deep dive into each metric and compare to previous months
- Quarterly: Review strategy based on metric performance
Track these five metrics every week. That's it. You'll have more clarity than 90% of other store owners.
Get a Custom Dashboard for Your WooCommerce Store
Stop manually calculating metrics. Let Sutra Analytics build you a custom dashboard that automatically tracks AOV, Conversion Rate, CAC, LTV, and Abandoned Cart Rate. Contact us today and get real-time visibility into your store performance.
— Sutra Analytics Team