
Google Sheets vs. Custom Dashboards: When to Make the Switch
Google Sheets is powerful, but there comes a point when you need something more. Here's how to know when it's time to upgrade to a custom dashboard.
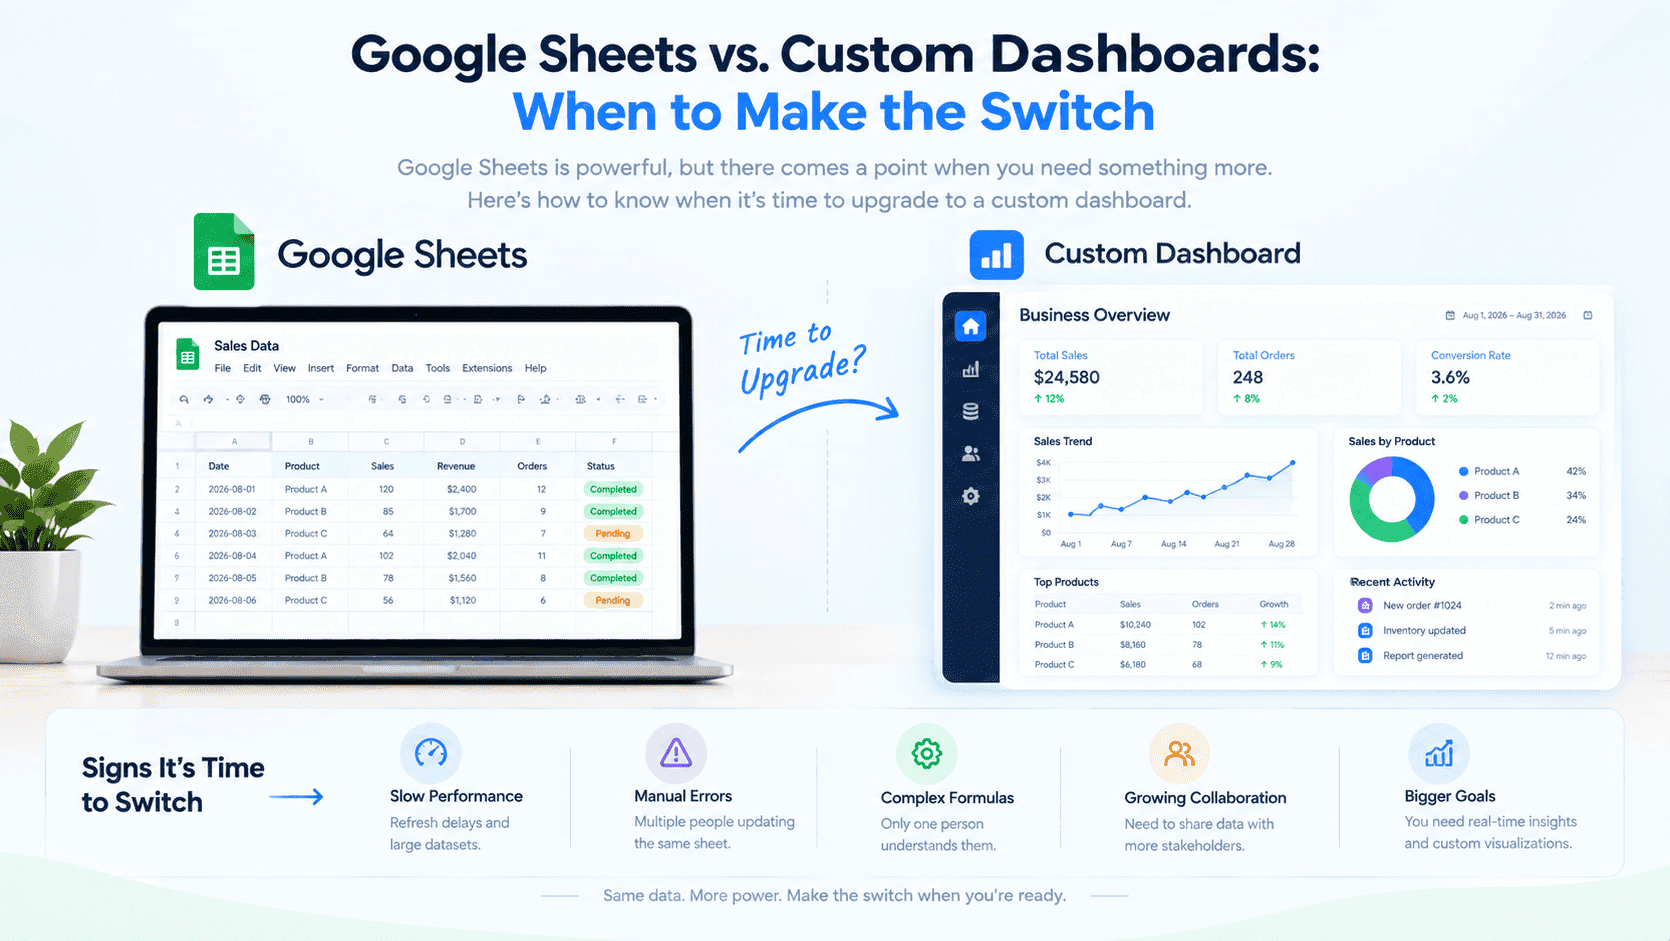
Google Sheets is one of the most underrated business tools. It's flexible, accessible, and familiar to almost everyone. For many businesses, it's the backbone of their reporting.
But at some point, you hit a ceiling. Maybe your spreadsheet has 50,000 rows and it's starting to slow down. Maybe you have three different people updating the same sheet and things are getting messy. Maybe you're spending more time managing the sheet than using the data in it.
When you reach that point, it's time to consider a custom dashboard.
The signs are usually clear: refresh delays that make real-time data impossible, error-prone manual updates, formulas so complex that only one person understands them, and a growing need to share data with multiple stakeholders.
The Hidden Costs of Sticking with Google Sheets Too Long
- Lost productivity: Your team spends 10+ hours/week managing spreadsheets
- Decision delays: You're making decisions on data that's 3-7 days old
- Errors: Manual data entry creates an average 15% error rate
- Scalability: As you grow, sheets become slower and less reliable
- Security: Sharing sensitive data via email links is risky
When to Make the Switch — A Decision Framework
Here's how to know where you stand:
Immediate Switch (1-3 months)
- Your sheet has more than 50,000 rows
- Multiple people are updating the same sheet
- You spend more time maintaining than using the data
- You need real-time data for daily decisions
Consider Switch (6-12 months)
- Your sheet has 10,000-50,000 rows
- You're sharing the sheet with external stakeholders
- You have complex formulas that break frequently
- You need basic visualizations
Stay with Sheets (no need to switch)
- Under 10,000 rows
- Only 1-2 people use the sheet
- Simple formulas and basic reporting needs
- Limited sharing requirements
What a Custom Dashboard Actually Looks Like:
A custom dashboard is a dedicated web application that connects to your data sources (CRM, e-commerce, accounting, etc.) and displays key metrics in real-time. Unlike Google Sheets, it's designed for viewing rather than editing. Users can filter, drill down, and export data without touching the underlying data structure.
At Sutra Analytics, we build custom dashboards that connect to your existing data sources — WooCommerce, Shopify, QuickBooks, Salesforce, and more. We transform your spreadsheets into real-time dashboards that your entire team can access and trust.
Key Features of a Custom Dashboard Built by Sutra Analytics
- Automatic data refresh (every minute, hour, or day)
- Role-based access (sales sees sales data, finance sees finance data)
- Interactive filtering and drill-down
- Mobile-responsive design
- Scheduled report delivery (PDF, email, Slack)
- Audit trails (who accessed what and when)
- Custom visualizations tailored to your business metrics
- Seamless integration with your existing tools
💡 The Cost of Custom Dashboards: Basic: $3,000-8,000 | Medium: $8,000-20,000 | Enterprise: $20,000+. Compare this to manual reporting cost: 10 hours/week × $50/hour = $26,000/year.
The switch doesn't have to be all or nothing. Start with your most important reports. Move those to a dashboard. See the difference. Then gradually migrate the rest.
Most businesses that make the switch never look back.
Ready to Build Your Dashboard with Sutra Analytics?
We'll identify your top 3 most-used reports, map out the data sources they need, and build a custom dashboard that gives you real-time visibility into your business. No more manual reporting. No more outdated data. Contact us today.
— Sutra Analytics Team