
CASE STUDY: Automated Stock Price Tracking & Analysis Using Polygon(Massive) API
Smart Automation That Helps Users Fetch & Analyse Stock Market Data Seamlessly Through Google Sheets
We helped a finance client automate their daily stock price tracking and analysis by integrating the Polygon(Massive) API with Google Sheets. Our custom-built solution removed the need for manual downloads, copy-pasting, or using multiple tools. The system allows the client to pull historical and real-time stock data with just a single click and instantly view it in a clean, organized format inside Google Sheets.
By automating the entire process—symbol selection, date range, intervals, and data fetching—the client now gets accurate OHLC data instantly without any manual work. This automation saved them significant time, reduced errors, and improved their ability to analyse market trends quickly. The system also includes a special feature to capture the exact 9:30 AM market opening price, helping the client study opening movements and daily trends more efficiently.
Overview

We helped a finance client automate their daily stock price tracking and analysis by integrating the Polygon (Massive) API directly with Google Sheets. Our custom-built solution eliminated the need for manual downloads, copy-pasting, or switching between multiple tools. With just a single click, the client can now pull both historical and real-time stock data and instantly view it in a clean, organized format inside Google Sheets.
By automating the entire workflow—symbol selection, date range, intervals, and data fetching—the client now receives accurate OHLC data instantly without any manual effort. This automation saved them significant time, reduced errors, and improved their ability to analyse market trends quickly. We also added a dedicated feature to capture the exact 9:30 AM market opening price, making it easier to study opening sentiment and daily trend behaviour.
Most importantly, the client now uses this structured and reliable data to make faster, smarter, and more confident trading decisions.
Client Requirement
The client works with daily stock market data and needed a simple system to check and analyse stock prices without wasting time.
Their Problems were:
Manual Data Download Was Time-Consuming
Every day, the client had to manually download stock price files, which became repetitive and slowed down their workflow.
Data Filtering & Cleaning Took Too Much Effort
The downloaded data had to be filtered, cleaned, and organized before analysis. This routine task consumed valuable time and led to delays in decision-making.
Needed Instant Stock Price Lookup for Any Date
The client wanted a tool where they could simply select a date and instantly view stock prices for that day—without downloading or processing files manually.
Tracking Multiple Stocks Was Difficult
They also wanted an easier way to track multiple stock tickers like AAPL, TSLA, AMZN, and more, without switching between multiple files or websites.
Required a Tool for Non-Technical Users
The solution had to be simple enough that anyone—regardless of technical skills—could use it with ease.
So the client wanted a solution where everything happens inside Google Sheets, and the data comes directly from the Polygon(Massive) API with no manual steps.
The system had to:
- ✅ Pull stock data automatically
- ✅ Support custom start and end dates
- ✅ Support time intervals like 5, 10, 15, 30, 45, 60, 90, 120 minutes
- ✅ Create a new sheet every time data is fetched
- ✅ Be extremely simple and user-friendly
- ✅ Run 100% on automation
Special Requirement:
The client needed stock data exactly at 9:30 AM, which is the opening time of the US stock market.
Our Solution – Automated Polygon(Massive) API Stock Tracker
We created a complete automation system inside Google Sheets that fetches data directly from Polygon(Massive) API and displays it in a clean format. The solution is built around one main sheet: Config Sheet. This Config sheet works like a small form where the user fills in details and clicks a button.
API Key Input
The user enters their Polygon (Massive) API key here, which allows the system to connect securely to the API. Without this key, data cannot be fetched. It ensures authorized and accurate data access.
Stock Symbol Input
This field is used to enter the stock ticker like AAPL, TSLA, or AMZN. It tells the system exactly which stock’s data to fetch. The user can change the symbol anytime for quick analysis.
Optional Start & End Dates
Users can select a custom date range for fetching data, such as last week, last month, or last year. If these fields are left blank, the system automatically sets the last 365 days as the default range. This makes the feature flexible and easy to use.
Interval Selection (5 to 60 min)
This dropdown allows users to choose the time interval for stock candles—from 5-minute data to 60-minute data. Smaller intervals show detailed intraday movements, while larger intervals show broader trends. If not selected, 5 minutes is used by default.
“Fetch API Data” Button
The main action button that triggers the entire automation. With one click, the system connects to the API, fetches stock data, creates a new sheet, and organizes everything neatly. No manual steps or coding required.
How It Works (Step-by-Step)
Our Stock Data Automation Works Through These Simple, Powerful Steps:
- Validates User Inputs: The system first checks whether the required fields—API key, stock symbol, and interval—are filled correctly. If dates or intervals are missing, it applies smart default values. This ensures the API request is always accurate and error-free.
- Builds the Required Polygon API URL: Based on the user inputs, the script automatically creates the correct API request URL. This includes the symbol, date range, interval, and API key. The user doesn’t need to understand URLs or API structure—everything is generated in the background.
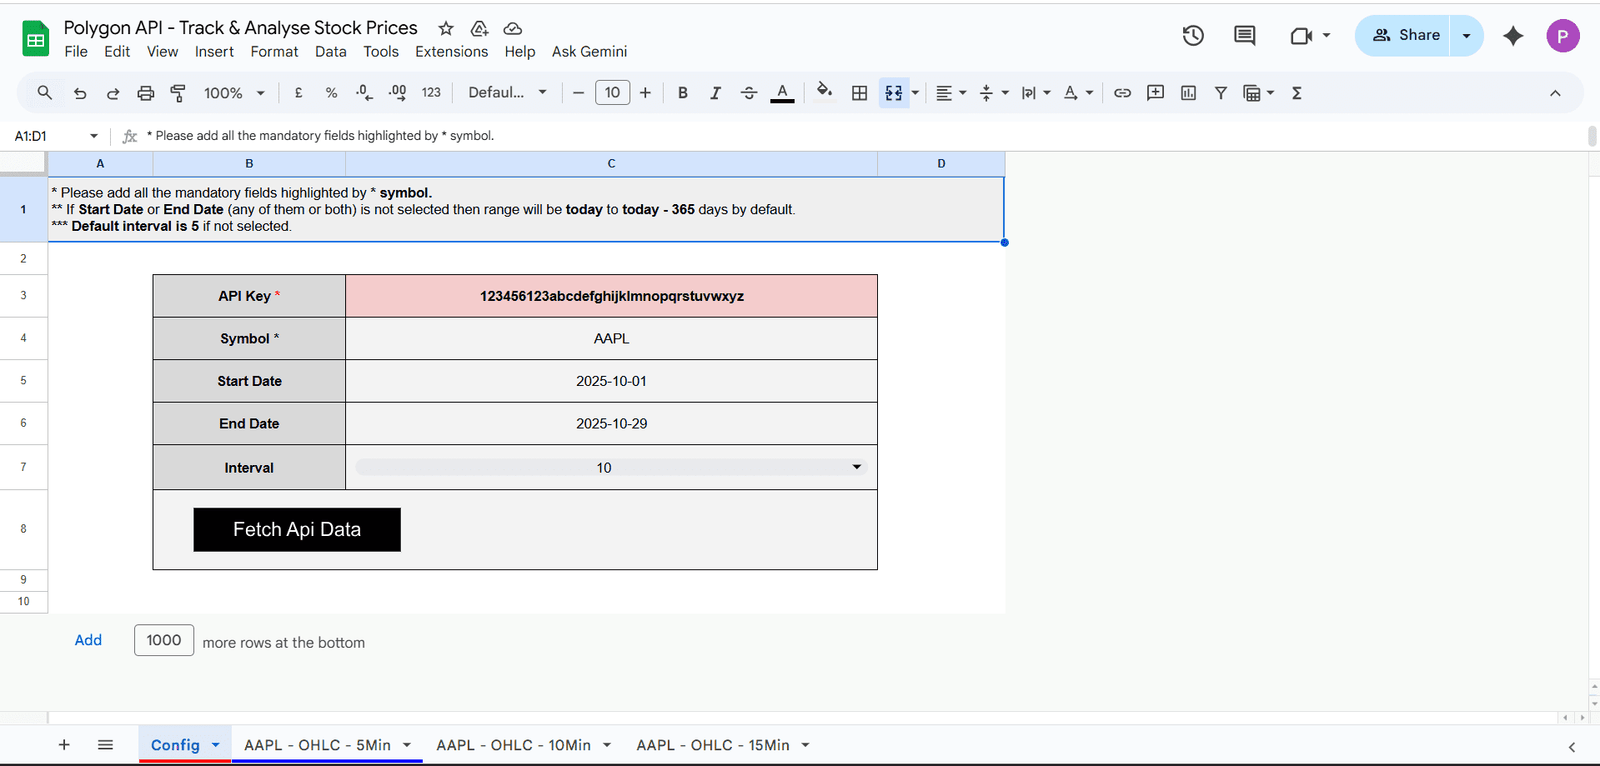
Fetches OHLC Data: The system connects to the Polygon (Massive) API and retrieves complete OHLC data: Open, High, Low, Close, Volume, and Timestamp. This gives the user accurate and detailed stock movement information.
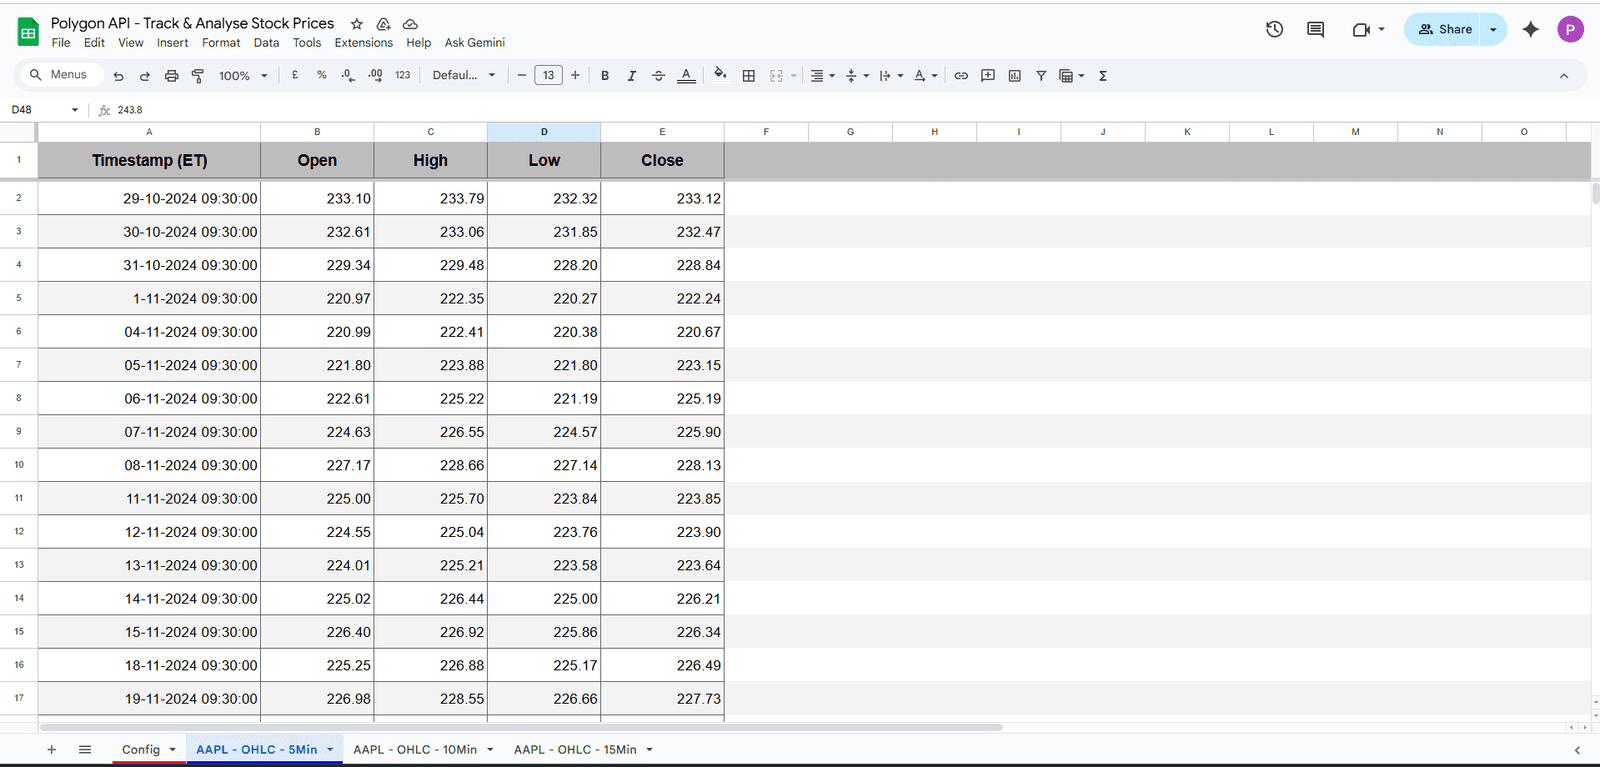
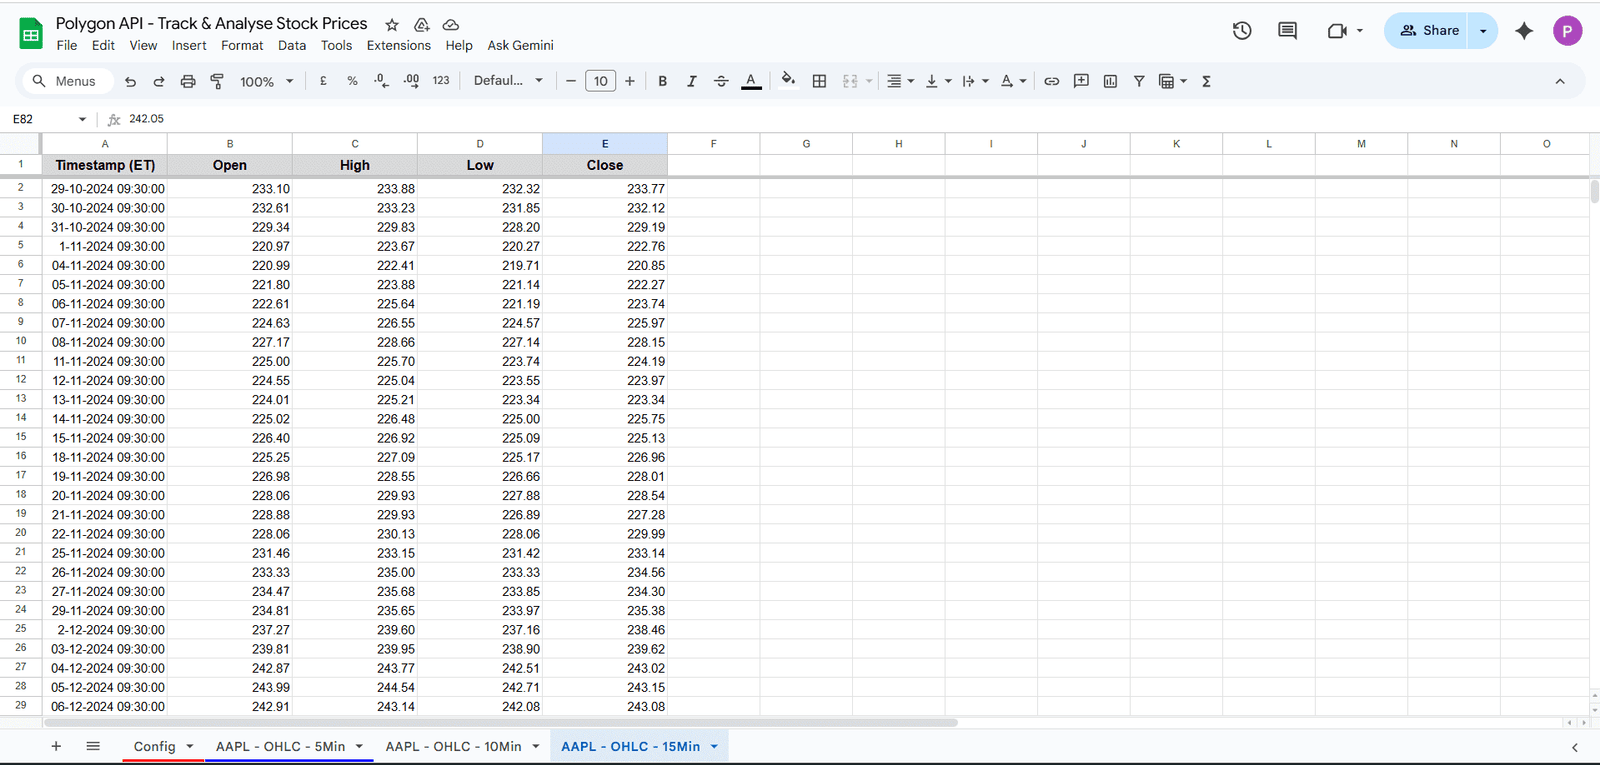
Automatically Creates a New Sheet: Once data is fetched, the tool creates a brand-new sheet with a clear name such as “AAPL – OHLC – 15Min”. This keeps every data fetch organized and easy to access without overwriting older data.
Inserts Data in a Neat, Formatted Structure: The new sheet is filled with clean, properly formatted data—column headers, timestamps, OHLC values, and volume. No duplicate rows, no unformatted data, and no messy layouts.
Data Instantly Usable for Charts & Analysis: Because the data is already structured, users can immediately create charts, comparisons, and trend analysis without any manual cleaning. This speeds up the entire analysis process.
- One Click → Fully Updated Stock Data: The entire automation—from fetching API data to creating a formatted sheet—happens with just one button click. Users get fresh, accurate stock data in seconds.
What the Client Gains From the 9:30 AM Opening Candle Feature
Client Advantages of the Automated 9:30 AM Opening Candle Extraction
- Detects the Exact 9:30 AM Candle: The system scans all fetched OHLC data and automatically picks the candle that matches the exact 9:30 AM timestamp. This ensures users always get the true opening price without manually searching for it.
- Helps Analyse Opening Sentiment: The first candle reflects immediate market reaction at the opening bell. By isolating it, users can quickly understand whether the market started strong, weak, or neutral.
Useful for Gap-Up / Gap-Down Studies: The 9:30 AM candle helps compare pre-market prices with the actual open, making it easier to identify gap-ups or gap-downs that influence early trading decisions.
Supports Multiple Intraday Strategies: Many intraday strategies rely on the first candle’s range and direction. This feature offers precise opening data that traders can use to plan their trades.
Helps Track Early Trend Direction: The opening candle often sets the tone for early market movement. Extracting it separately helps users identify immediate trends or reversals right from market open.
Stored Separately for Easy Comparison: The extracted data is saved in a dedicated sheet, allowing users to compare daily openings effortlessly and track long-term patterns.
Outcome for the Client
Our automation system helped the client:
✅ Save hours of work every week
✅ Get stock data instantly with a single click
✅ Analyse any stock without manual downloads
✅ Track multiple time intervals easily
✅ Automatically get 365 days of data if dates are not selected
✅ Stay organized with auto-created sheets
✅ Receive the daily 9:30 AM opening price
✅ Build charts and analysis inside Google Sheets
Overall Result:
The client’s stock research process became over 90% faster and completely error-free.
They can now focus on analysis and decision-making, not on collecting data.
Client Testimonial
Conclusion
The automated Polygon(Massive) API stock tracking system completely transformed the client’s workflow. Tasks that once required manual downloads, filtering, and repeated data entry are now handled instantly inside Google Sheets with a single click. With automated symbol selection, flexible date ranges, multi-interval OHLC data, and the powerful 9:30 AM opening candle extraction, the client now receives clean, reliable, and ready-to-analyse data in seconds.
This upgrade not only eliminated errors and saved several hours per week but also gave the client a faster and more structured way to study market movements and price behaviour.
Most importantly, the client now uses this clean, automated dataset to make faster and more confident trading decisions, backed by accurate real-time and historical stock insights.
Let's Connect
Ready to streamline your stock analysis with Polygon API automation?
This case study showed how we automated real-time and historical stock data fetching inside Google Sheets—saving hours of manual work, eliminating errors, and helping the client make faster, more confident trading decisions.
If you rely on stock data and want a smarter, automated workflow, we can build the perfect solution for you.
Fetch real-time & historical stock data — instantly
Keep your stock analysis clean, organized, and error-free
Automate repetitive tasks like downloads, filtering, and formatting
Capture the 9:30 AM opening candle automatically for better trading insights
Build a system customized to your trading style or business workflow
Let’s talk about your use case — contact us for a quick consultation.